Setting Up an Intrusion Detection System with Suricata
Suricata is a free and open-source intrusion detection system (IDS) and intrusion prevention system (IPS) that is used to monitor and protect computer networks against malicious activity. It is a high-performance system that can analyze network traffic in real-time and alert administrators to potential security threats. Suricata can also be configured to block suspicious traffic, preventing malicious activity from reaching its target. This article will provide a step-by-step guide to setting up Suricata on a Linux-based system, as well as tips for configuring and customizing the system to suit your needs. By the end of this article, you will have a functional IDS/IPS that can help protect your network from a variety of security threats.
If you want to be able to monitor all of the traffic on your network, you’ll need to make sure you connect the device running Suricata to a router or switch that has port mirroring enabled so that all the traffic that passes through is mirrored to the device running Suricata. My router does not have port mirroring so I’ll just be monitoring the traffic going directly to the Raspberry Pi for this article.
Installing Suricata
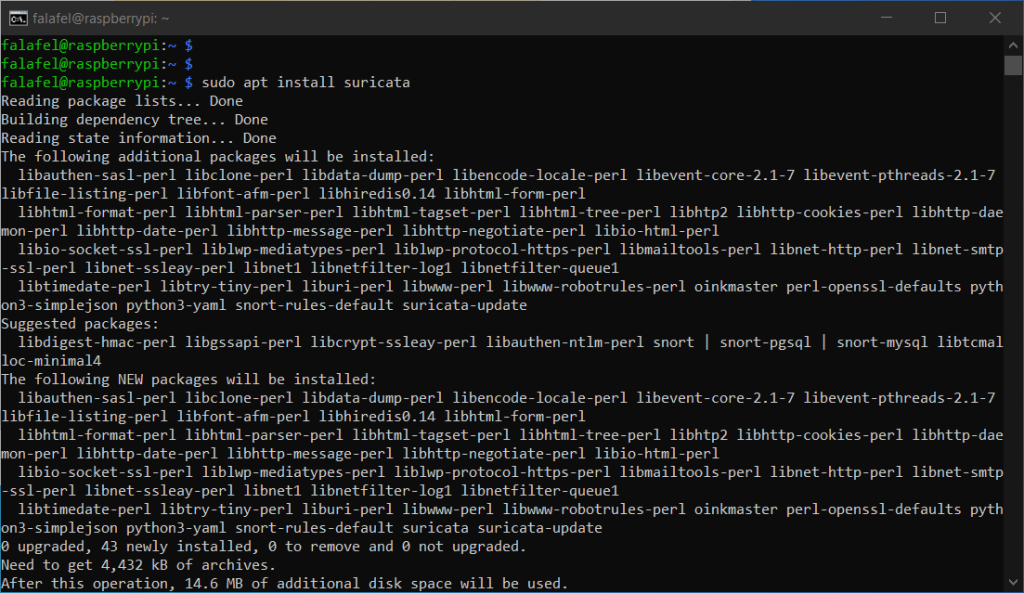
If you are using Linux you can use the local package manager to install Suricata by running sudo apt install suricata.
Now that we have Suricata installed, navigate to /etc/suricata. Here we have a couple .config files, our default rules, and most importantly the suricata.yaml file. The suricata.yaml file is the main configuration file for Suricata. It contains all the parameters and settings necessary to customize the behavior of Suricata according to the user’s specific needs. This includes defining network interfaces to monitor, specifying rule files to use, setting alert thresholds, configuring logging behavior, and many other options. By editing the suricata.yaml file, users can fine-tune Suricata to detect and respond to specific types of network activity.
Configuring Suricata
First we want to copy our configuration file, that way if we make any mistakes or wrong configurations we can easily copy from or revert back to the original. To do this enter sudo cp /etc/suricata/suricata.yaml /etc/suricata/suricata.yaml.orig.
After you make a copy of the configuration file open suricata.yaml using your text editor of choice to start configuring.
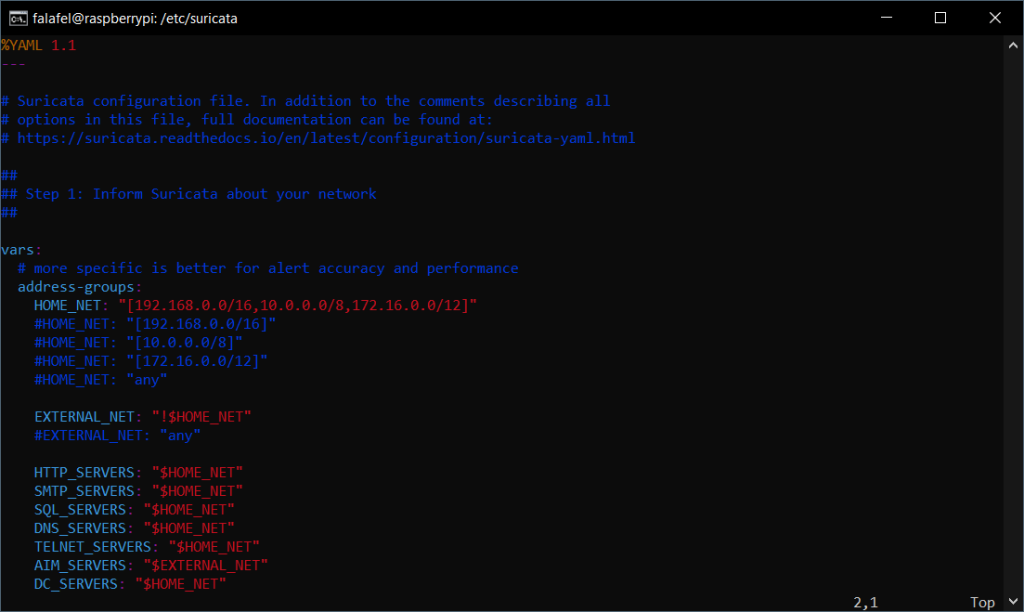
This file contains 1900+ lines and has countless configuration options that you can customize and fine tune as you need, but today, we will be sticking with most of the default settings. One thing we are going to focus on today is the rules section, which you will find on line 1868.
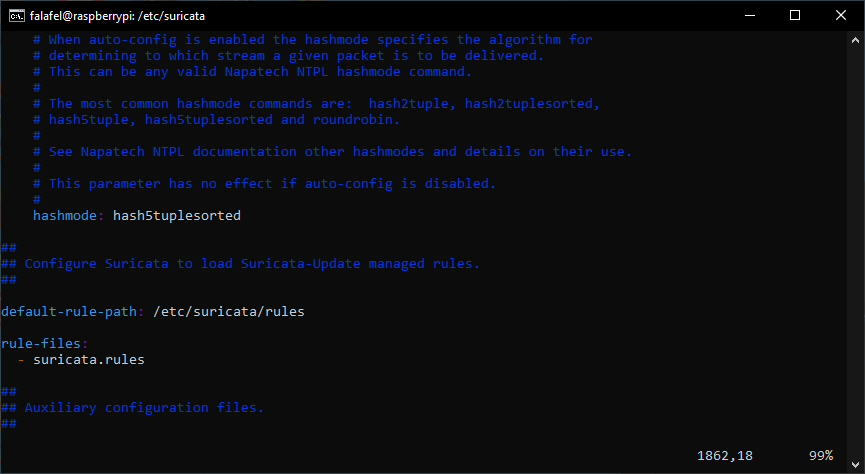
As you can see the default rules path is /etc/suricata/rules. The default ruleset is a bit limited so we’re going to be updating it.
Updating the Ruleset
We’re going to be using suricata-update to get our updated ruleset, suricata-update is a command-line tool used to update the rules and configurations of Suricata. It connects to the Suricata update server to download the latest ruleset, including emerging threats, and updates the existing rules in Suricata’s configuration. Suricata-update also provides an easy way to manage multiple ruleset sources and switch between them. Type sudo suricata-update to use the Suricata Update tool.
suricata-update downloads the Emerging Threats ruleset by default. Emerging Threats is a well-established and trusted provider of high-quality threat intelligence. Their ruleset is frequently updated with the latest threat information, which helps ensure that Suricata is detecting and blocking the latest threats. This will work perfectly for us, but if you wanted to configure suricata-update to use a different third party ruleset by default you can add the URL in the suricata.yaml file.
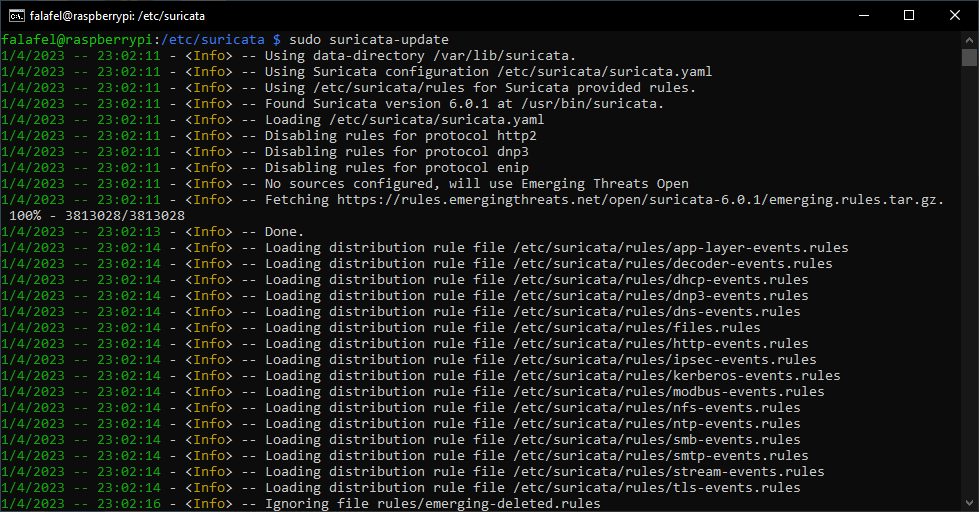
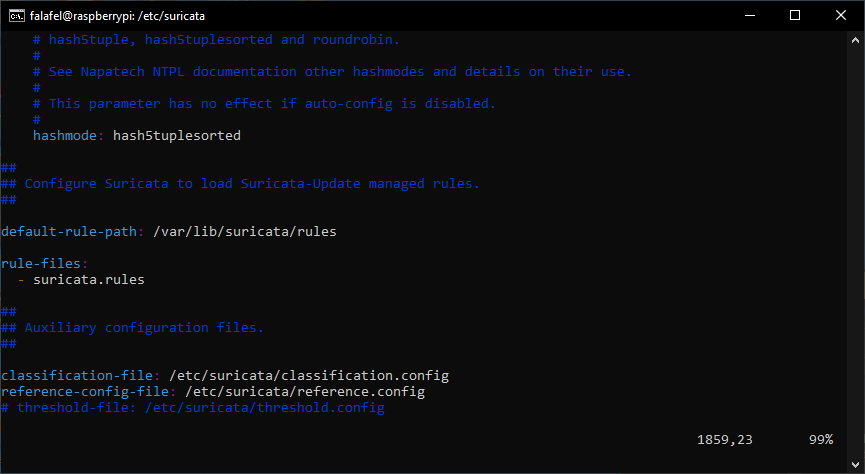
The default destination for these updated rules is /var/lib/suricata/rules so we’ll need to open up the configuration file and change the default rule path to this location.
Running Suricata
Now that we’ve told Suricata to use our updated ruleset and where to find it we will run the program to start monitoring our network. Start Suricata by entering sudo suricata -c /etc/suricata/suricata.yaml -i [interface name].
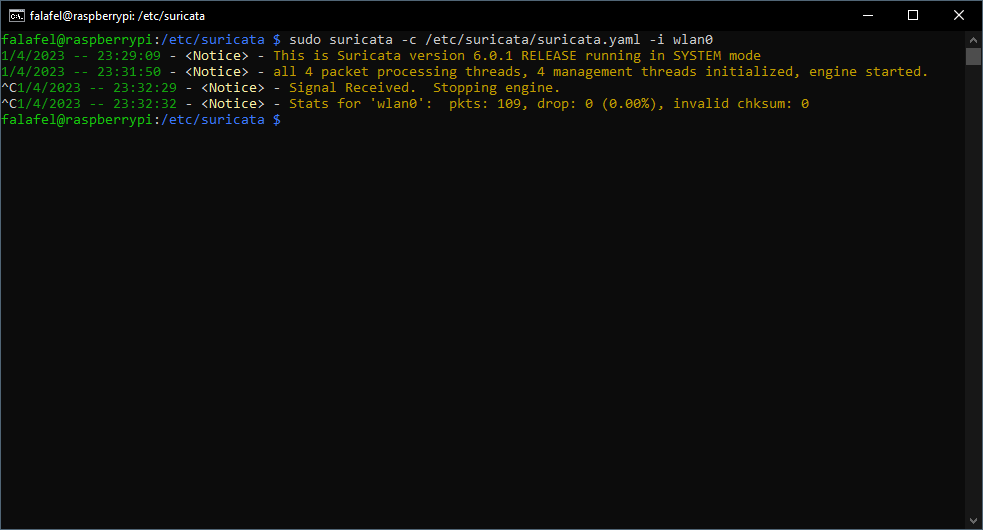
Let the program run for a bit so it can capture some traffic and then push ctrl+c to stop it. Now its time to check the logs and see if anything was triggered.
Checking Suricata Logs
Suricata generates logs of the network activity that it detects. These logs are stored in the directory specified in the output option in the configuration file. The default location for the logs is /var/log/suricata. The different logs contained are eve.json, fast.log, stats.log, and suricata.log.
eve.json – contains detailed information about each network event that Suricata detects, such as the time, source and destination IP addresses, and the type of alert generated.
fast.log – contains a high-level summary of the events captured in the eve.json log.
stats.log – contains statistical information about Suricata’s performance, including the number of packets processed and the number of alerts generated.
suricata.log – contains information about Suricata’s initialization process, configuration, and various events that occur during runtime, such as alerts, dropped packets, and flow sessions. This log file is important for monitoring the behavior of Suricata and for troubleshooting any issues that may arise.
Let’s take a look at our fast log and see if anything was picked up. Go to /var/log/suricata and enter tail fast.log to see the contents of the log.
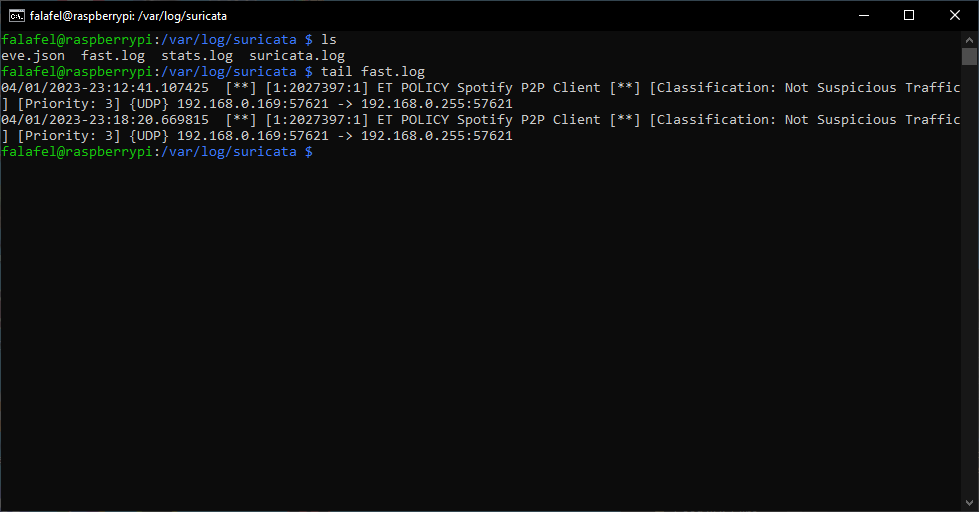
Like I mentioned earlier, I’m only monitoring traffic coming directly to my Raspberry Pi so there isn’t much to see, but it looks like it picked up a peer to peer broadcast from my my other computer running Spotify. Like the logs show, this isn’t suspicious activity, but its important to see how the fast log looks for when we take a deeper dive in coming entries.
For further learning check out https://suricata.readthedocs.io/en/suricata-6.0.10/. This is hardly scratching the surface of what Suricata is capable of and the degree to which you can customize the suricata.yaml configuration.
I’ll be putting up more about this topic going forward so look for my next posts about configuring alerts, creating your own custom rules in Suricata, and even testing our alerts by simulating an attack on our Suricata box. Stay tuned and thanks for reading.